With labor shortages on the rise, employers are understandably concerned.
Yet some industries are suffering more than others.
Below, we’ll dive into the latest data surrounding global labor shortages and other relevant statistics:
Contents
- Top Labor Shortage Statistics 2023 (Editor’s Picks)
- Current Labor Shortage Stats
- US Labor Shortage Rates
- Labor Shortage Rates By Country
- Global Labor Shortage Stats
- US Labor Shortage Stats
- UK Labor Shortage Stats
- European Labor Shortage Stats
Top Labor Shortage Statistics 2023 (Editor’s Picks)
- 77% of employers are not able to fill job vacancies
- The US has a labor shortage of 75%
- IT & data skills are most in-demand 27%
- The US has a labor force participation of 62.2%
- Bricklaying are the most in-demand profession in Europe (19 countries)
Current Labor Shortage Stats
According to ManpowerGroup, almost 4 in 5 (77%) employers are struggling to fill job vacancies - that’s the highest figure on record since surveys began in 2006.
In fact, the number of employers reporting labor shortages has more than doubled since 2015 (38%).
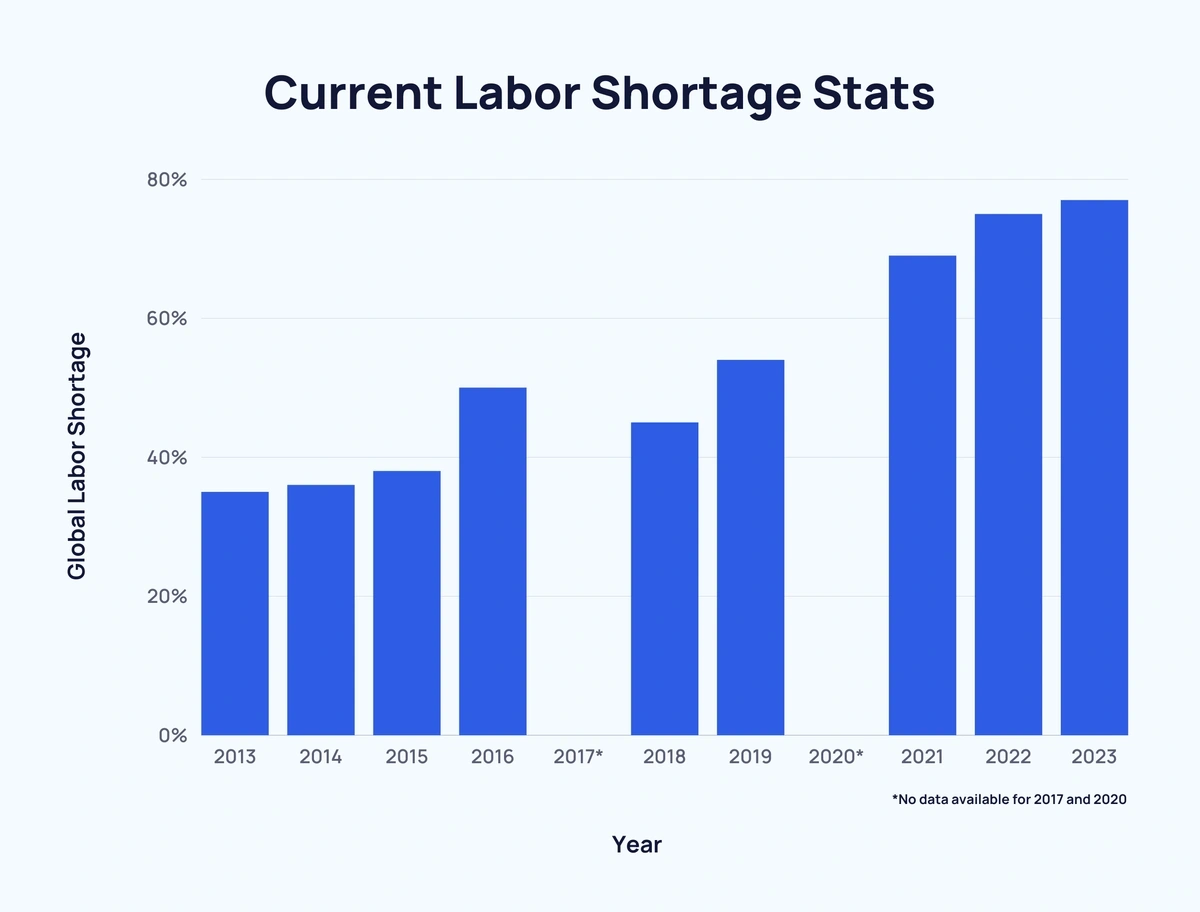
Here’s a look at global labor shortage figures over the last decade:
| Year | Global Labor Shortage | Change Over Previous Recorded Year |
| 2013 | 35% | - |
| 2014 | 36% | +1% |
| 2015 | 38% | +2% |
| 2016 | 50% | +12% |
| 2017 | - | - |
| 2018 | 45% | -5% |
| 2019 | 54% | +9% |
| 2020 | - | - |
| 2021 | 69% | +15% |
| 2022 | 75% | +6% |
| 2023 | 77% | +2% |
Source: ManpowerGroup
US Labor Shortage Rates
In the US, talent scarcity is on the rise.
As of 2023, US labor shortage currently sits at 75%, just under the global average.
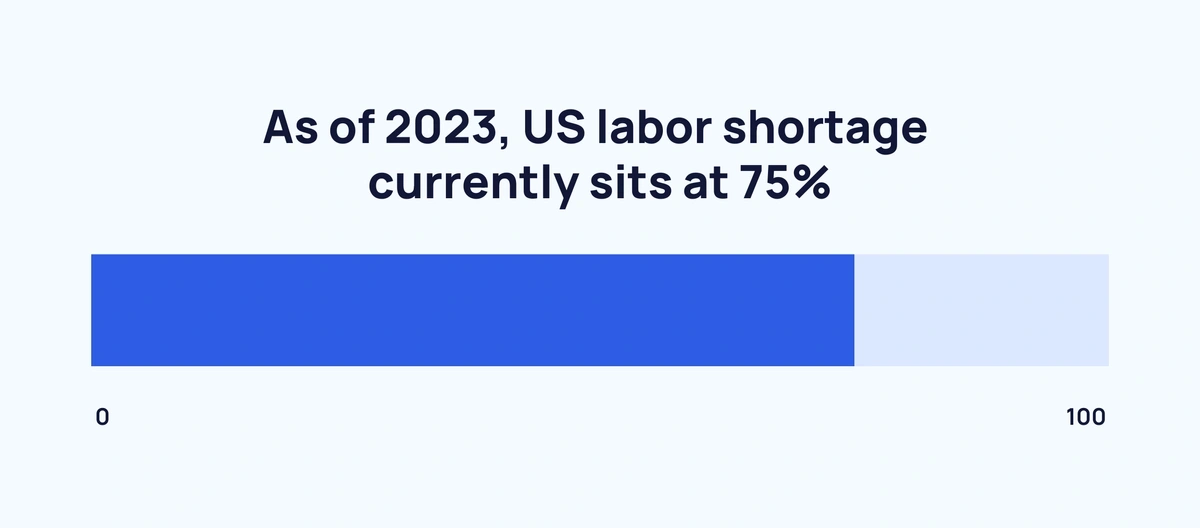
That means that 3 in 4 employers are unable to find suitable employees for their job vacancies.
Source: ManpowerGroup
Labor Shortage Rates By Country
Taiwan has the highest recorded labor shortage rate at 90%. That’s 13% higher than the global average.
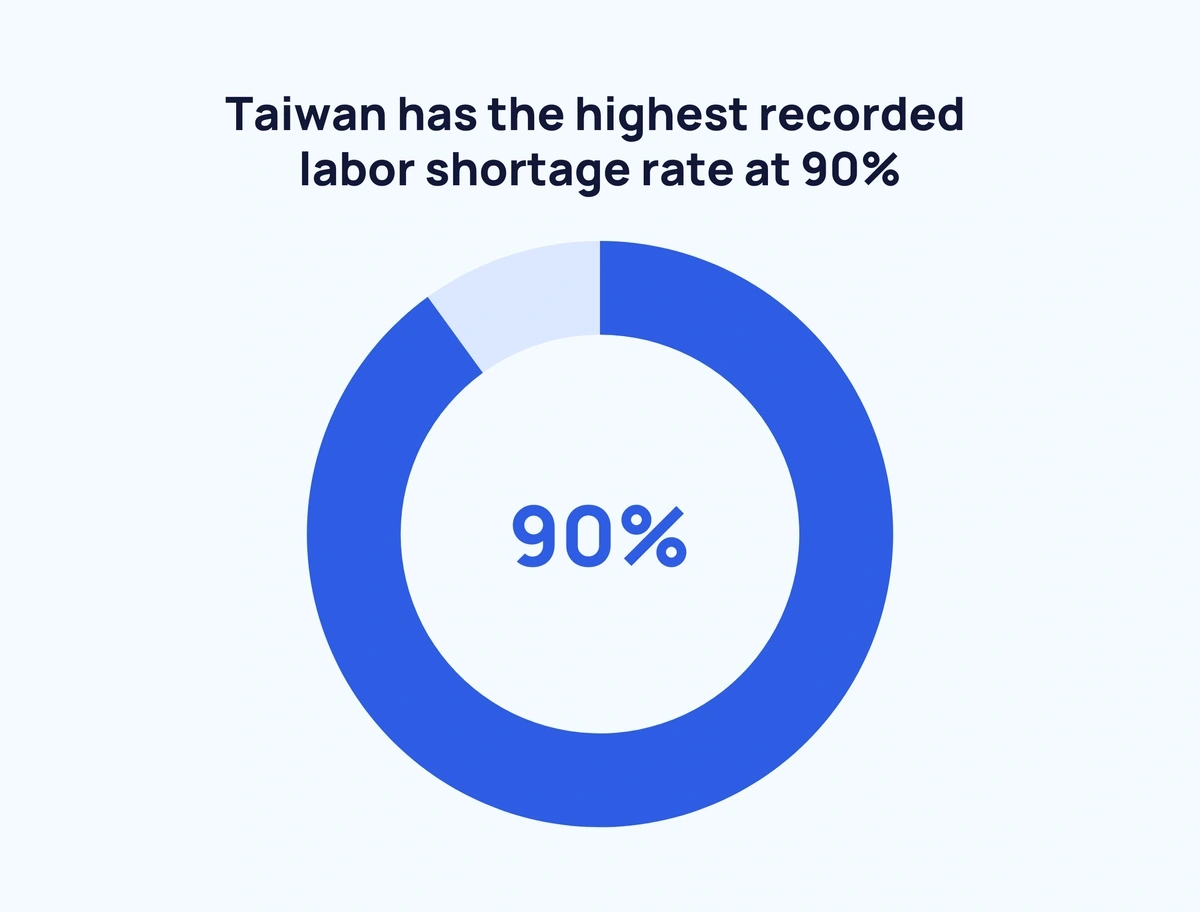
On the other end of the scale, Colombia has a labor shortage rate of 64% - 13% lower than the worldwide rate.
Here’s a breakdown of labor shortages for selected countries across the world:
| Country/Territory | Region | Labor Shortage |
| Global Average | - | 77% |
| Taiwan | Asia | 90% |
| Germany | Europe | 86% |
| Hong Kong | Asia | 85% |
| Portugal | Europe | 84% |
| Puerto Rico | North America | 83% |
| Singapore | Asia | 83% |
| Hungary | Europe | 82% |
| Austria | Europe | 81% |
| China | Asia | 81% |
| Finland | Europe | 81% |
| Ireland | Europe | 81% |
| Romania | Europe | 81% |
| Belgium | Europe | 80% |
| Brazil | South America | 80% |
| France | Europe | 80% |
| India | Asia | 80% |
| Spain | Europe | 80% |
| UK | Europe | 80% |
| Australia | Oceania | 79% |
| Canada | North America | 79% |
| Argentina | South America | 78% |
| Japan | Asia | 78% |
| Greece | Europe | 77% |
| Sweden | Europe | 77% |
| Israel | Asia | 76% |
| South Africa | Africa | 76% |
| Switzerland | Europe | 76% |
| Italy | Europe | 75% |
| US | North America | 75% |
| Norway | Europe | 74% |
| Netherlands | Europe | 73% |
| Guatemala | North America | 72% |
| Poland | Europe | 72% |
| Turkey | Europe/Asia | 72% |
| Costa Rica | North America | 71% |
| Peru | South America | 70% |
| Mexico | North America | 69% |
| Slovakia | Europe | 68% |
| Czechia | Europe | 66% |
| Panama | North America | 65% |
| Colombia | South America | 64% |
By 2030, it is predicted that there will be a global talent shortage of around 85 million people, resulting in revenue losses of approximately $8.5 trillion.
Source: Korn Ferry
Global Labor Shortage Stats
IT and data technical skills are the most in demand. In total, 27% of employers are searching for talent with these technical skills.
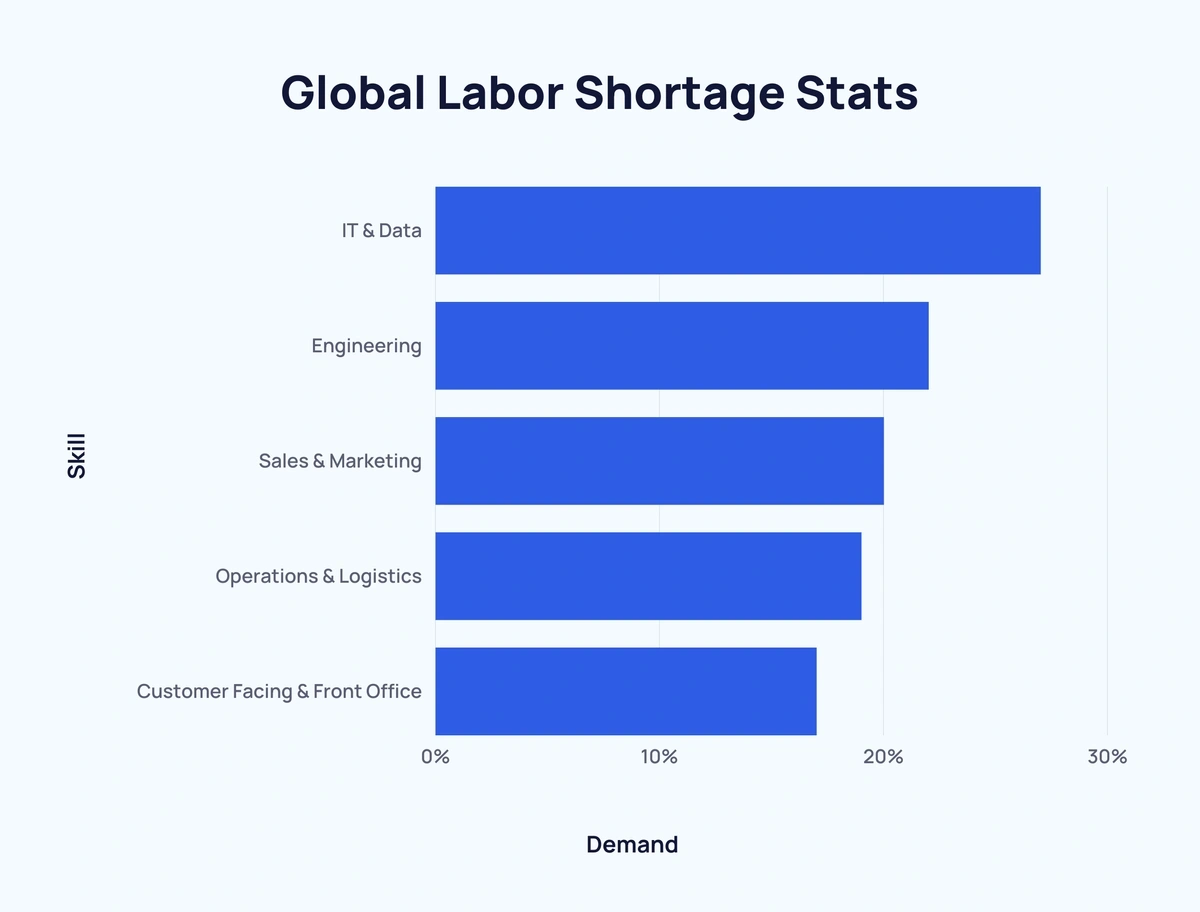
Here are the top five most in-demand technical skills:
| Rank | Skill | Demand |
| 1 | IT & Data | 27% |
| 2 | Engineering | 22% |
| 3 | Sales & Marketing | 20% |
| 4 | Operations & Logistics | 19% |
| 5 | Customer Facing & Front Office | 17% |
In terms of soft skills, reliability and self-discipline are the most sought-after (29%).
These are the most in-demand soft skills right now:
| Rank | Skill | Demand |
| 1 | Reliability & Self-Discipline | 29% |
| =2 | Creativity & Originality | 26% |
| =2 | Critical Thinking & Analysis | 26% |
| =2 | Reasoning & Problem-Solving | 26% |
| =2 | Resilience & Adaptability | 26% |
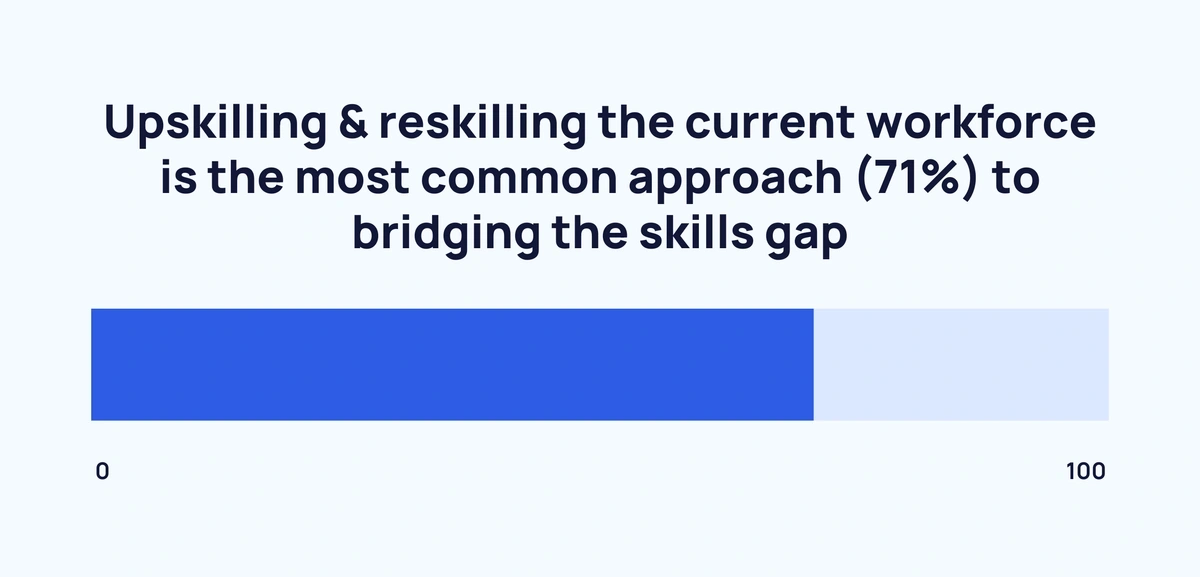
As a means to address the skills gap, employers are more willing than ever to invest in their existing talent.
Upskilling & reskilling the current workforce is the most common approach (71%) to bridging the skills gap.
Here are the ways in which employers are combatting the skills gap:
| Rank | Strategy | Proportion Implementing |
| 1 | Upskilling & reskilling their current workforce | 71% |
| 2 | Plan on filling new, permanent roles | 51% |
| 3 | Report investing in more tech to augment processes | 43% |
| 4 | Will bring in more contract or temporary roles | 37% |
| 5 | Have no plans for any of the above | 4% |
Over half (57%) of employers are now offering more flexibility at work when it comes to where (location, hybrid, remote) and when (part-time, flexible hours).
Increasing wages - especially within the IT industry (37%) - is the second-most common approach (33%). This is alongside looking at new talent pools (mature workers, etc.), which is also being explored by 33% of employers.
Here’s a breakdown of how organizations are overcoming talent shortages:
| Rank | Solution | Proportion Implementing |
| 1 | Offering more flexibility about when* and where** | 57% |
| =2 | Increasing wages, especially within the IT industry (37%) | 33% |
| =2 | Looking at new talent pools (mature workers, etc.) | 33% |
| 4 | Offering joining bonuses | 26% |
| 5 | Prioritizing automation for selected/tasks processes | 24% |
| 6 | Reducing qualification requirements | 18% |
Source: ManpowerGroup
US Labor Shortage Stats
The US has lost as many as 1.4 million workers from the labor force since February 2020.
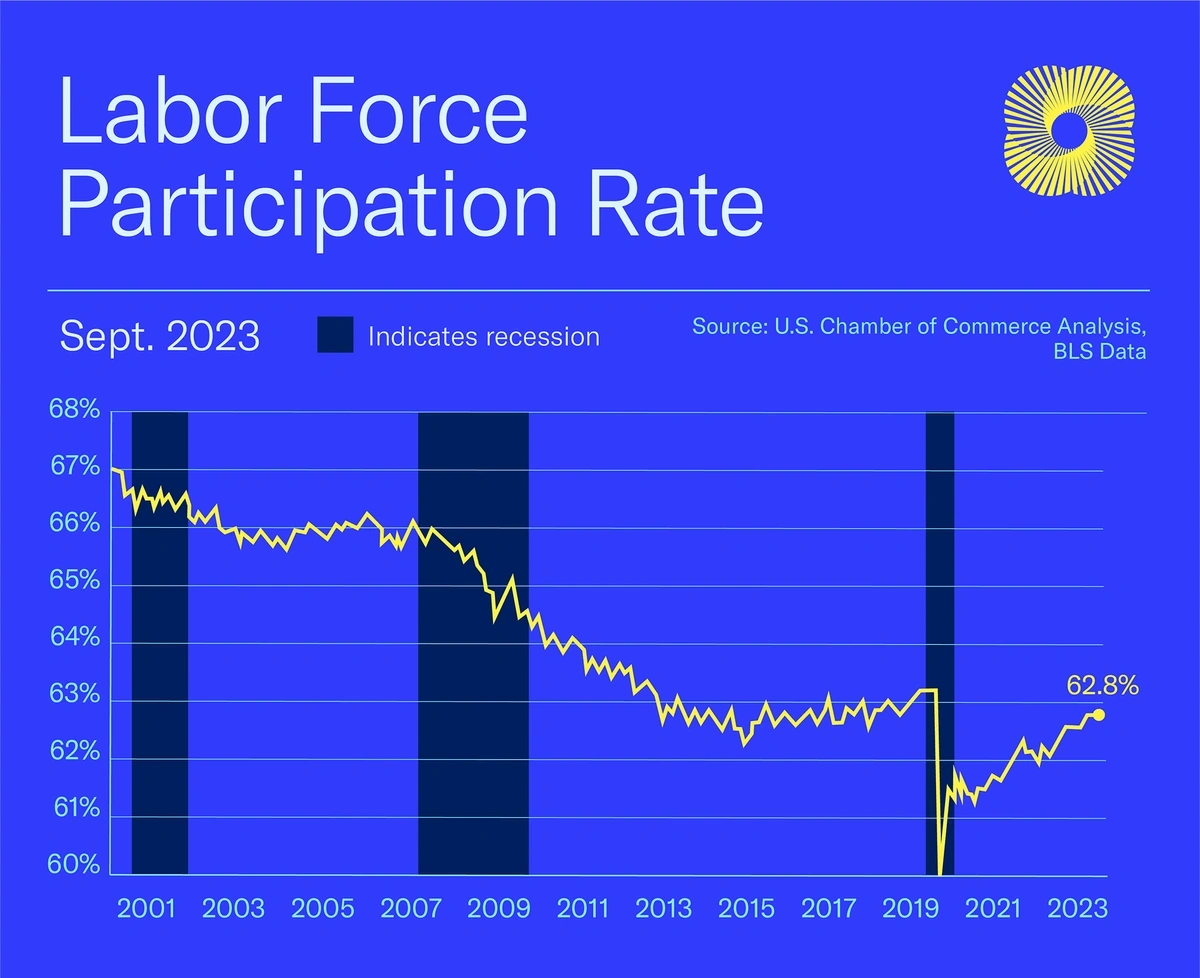
In 2022, the US had a labor force participation of 62.2%.
Here’s how that figure compares to the top 10 countries for labor force participation:
| Rank | Country | Labor Force Participation |
| 1 | Qatar | 88.29% |
| 2 | Madagascar | 85.9% |
| 3 | Solomon Islands | 83.64% |
| 4 | Tanzania | 82.6% |
| 5 | UAE | 82.21% |
| 6 | Ethiopia | 80.58% |
| 7 | Burundi | 79.73% |
| 8 | Mozambique | 78.48% |
| 9 | Eritrea | 77.6% |
| 10 | Angola | 76.87% |
| - | US | 62.2% |
Sources: US Chamber of Commerce, Statista
UK Labor Shortage Stats
In recent times, the number of UK businesses experiencing a labor force shortage has remained between 11.5% and 15.7%.
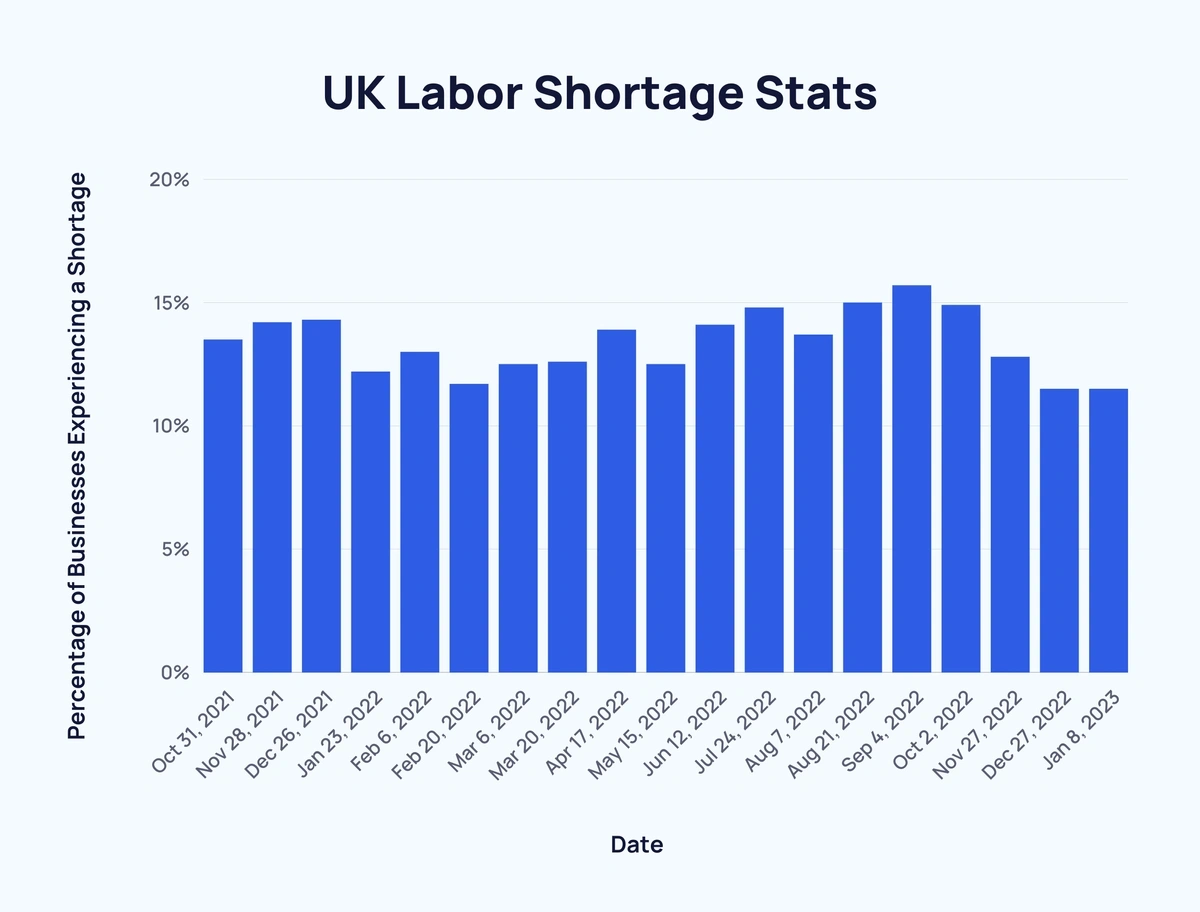
Here’s a breakdown of the figures according to the UK Office for National Statistics:
| Date | Businesses Experiencing a Shortage (%) |
| Oct 31, 2021 | 13.5% |
| Nov 28, 2021 | 14.2% |
| Dec 26, 2021 | 14.3% |
| Jan 23, 2022 | 12.2% |
| Feb 6, 2022 | 13% |
| Feb 20, 2022 | 11.7% |
| Mar 6, 2022 | 12.5% |
| Mar 20, 2022 | 12.6% |
| Apr 17, 2022 | 13.9% |
| May 15, 2022 | 12.5% |
| Jun 12, 2022 | 14.1% |
| Jul 24, 2022 | 14.8% |
| Aug 7, 2022 | 13.7% |
| Aug 21, 2022 | 15% |
| Sep 4, 2022 | 15.7% |
| Oct 2, 2022 | 14.9% |
| Nov 27, 2022 | 12.8% |
| Dec 27, 2022 | 11.5% |
| Jan 8, 2023 | 11.5% |
Across all industries, 11.5% of businesses are experiencing a labor shortage in the UK.
Accommodation and food service companies are the worst affected. Over 1 in 4 (25.3%) of them are short on workers.
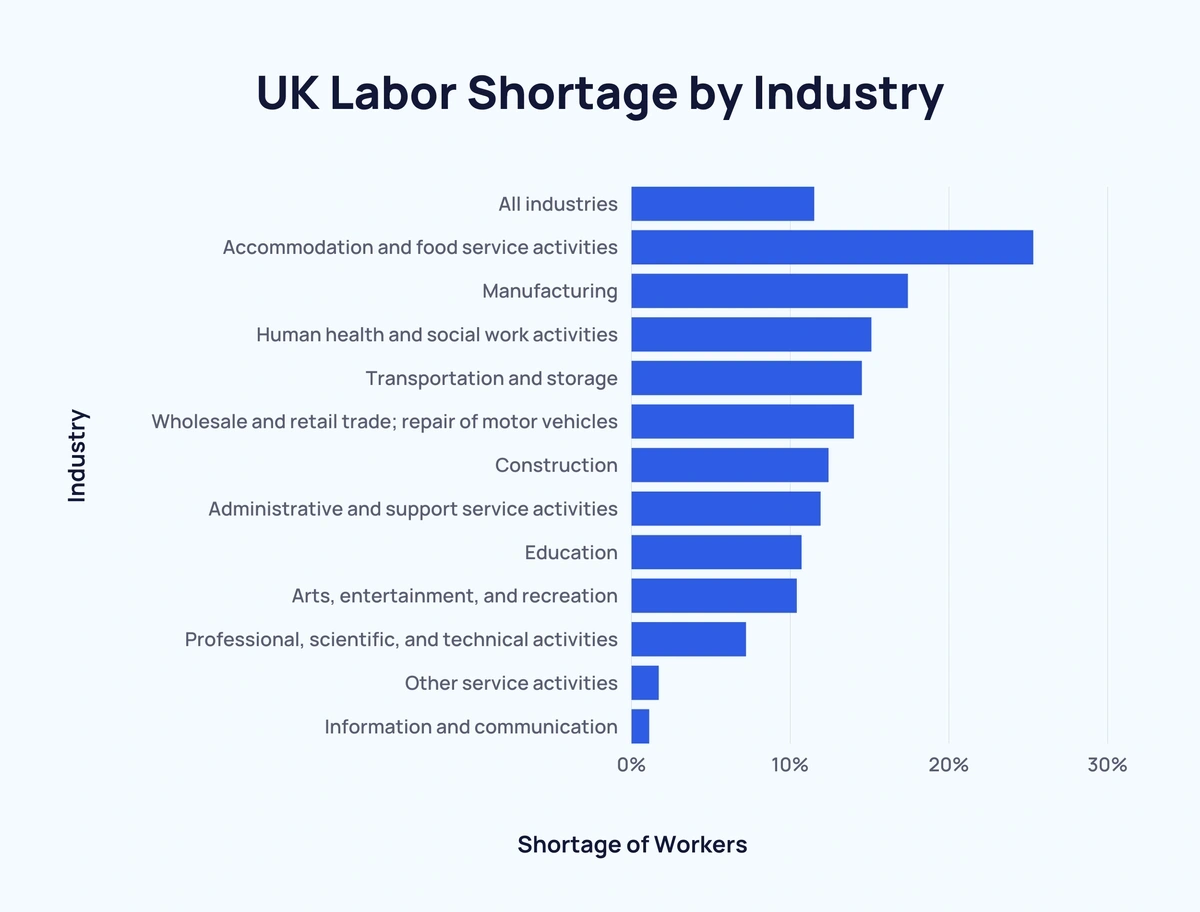
Here’s a breakdown of UK labor shortage by industry:
| Rank | Industry | Shortage of Workers |
| - | All industries | 11.5% |
| 1 | Accommodation and food service activities | 25.3% |
| 2 | Manufacturing | 17.4% |
| 3 | Human health and social work activities | 15.1% |
| 4 | Transportation and storage | 14.5% |
| 5 | Wholesale and retail trade; repair of motor vehicles | 14% |
| 6 | Construction | 12.4% |
| 7 | Administrative and support service activities | 11.9% |
| 8 | Education | 10.7% |
| 9 | Arts, entertainment, and recreation | 10.4% |
| 10 | Professional, scientific, and technical activities | 7.2% |
| 11 | Other service activities | 1.7% |
| 12 | Information and communication | 1.1% |
European Labor Shortage Stats
Labor shortages across Europe vary considerably from country to country.
Switzerland has a total of 240 occupations with labor shortages, comfortably more than second-placed neighbours Italy (204).
At the other end of the scale, Greece has just 6 occupations experiencing a labor shortage.
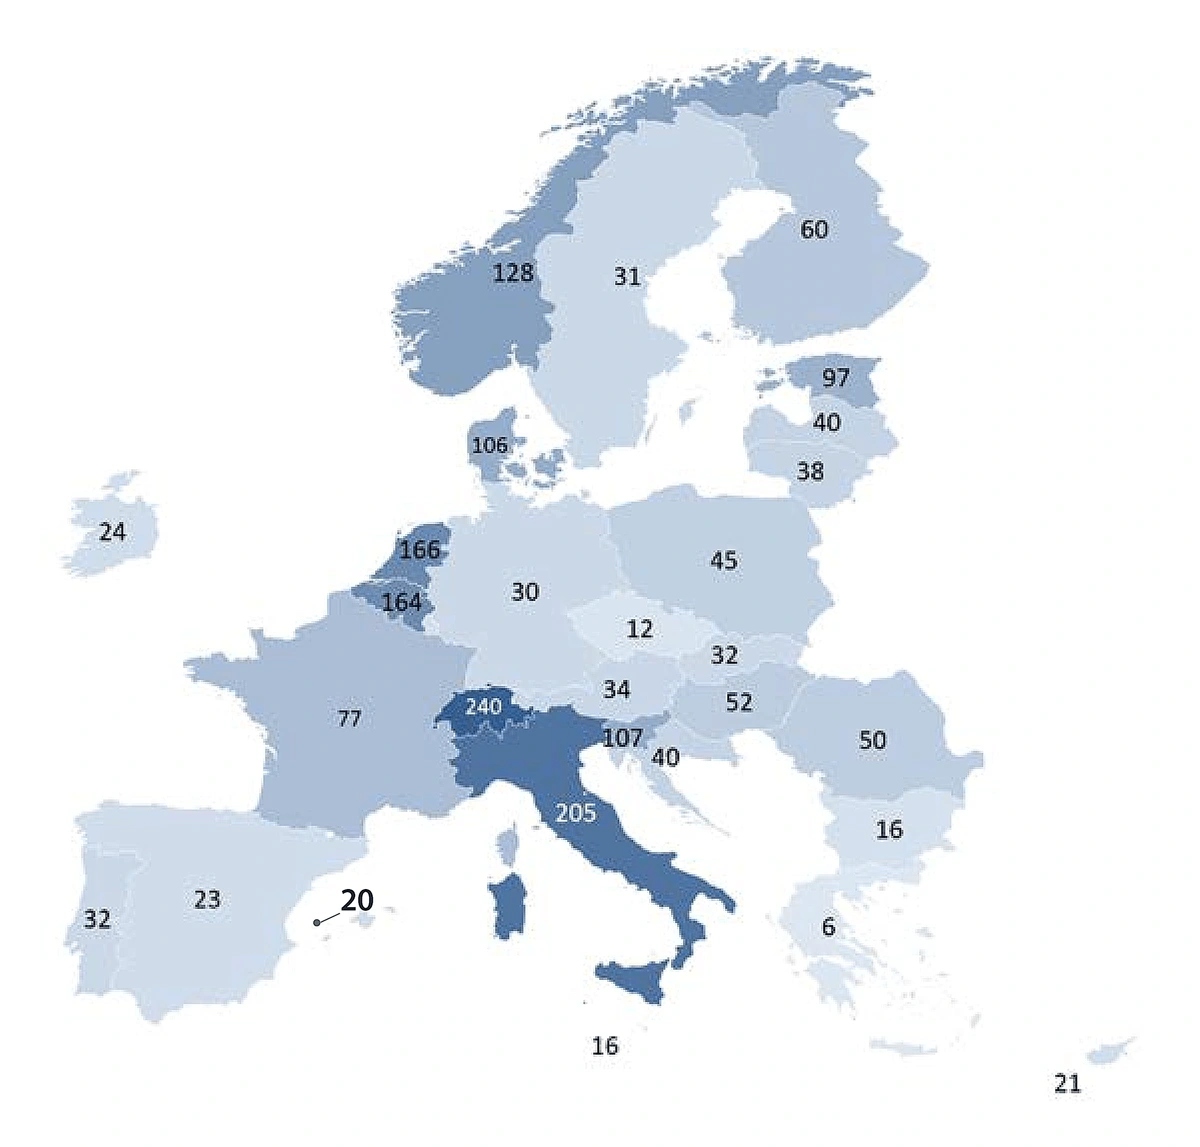
Here’s a list of 29 European nations ranked by number of occupations experiencing labor shortages:
| Rank | Country | Number of Shortage Occupations |
| 1 | Switzerland | 240 |
| 2 | Italy | 205 |
| 3 | Netherlands | 166 |
| 4 | Belgium | 164 |
| 5 | Norway | 128 |
| 6 | Slovenia | 107 |
| 7 | Denmark | 106 |
| 8 | Estonia | 97 |
| 9 | France | 77 |
| 10 | Finland | 60 |
| 11 | Hungary | 52 |
| 12 | Romania | 50 |
| 13 | Poland | 45 |
| =14 | Croatia | 40 |
| =14 | Latvia | 40 |
| 16 | Lithuania | 38 |
| 17 | Austria | 34 |
| 18 | Portugal | 32 |
| 19 | Slovakia | 32 |
| 20 | Sweden | 31 |
| 21 | Germany | 30 |
| 22 | Ireland | 24 |
| 23 | Spain | 23 |
| 24 | Cyprus | 21 |
| 25 | Luxembourg | 20 |
| =26 | Bulgaria | 16 |
| =26 | Malta | 16 |
| 28 | Czechia | 12 |
| 29 | Greece | 6 |
Bricklayers and related industries are experiencing labor shortages in more European countries than any other sector (19).
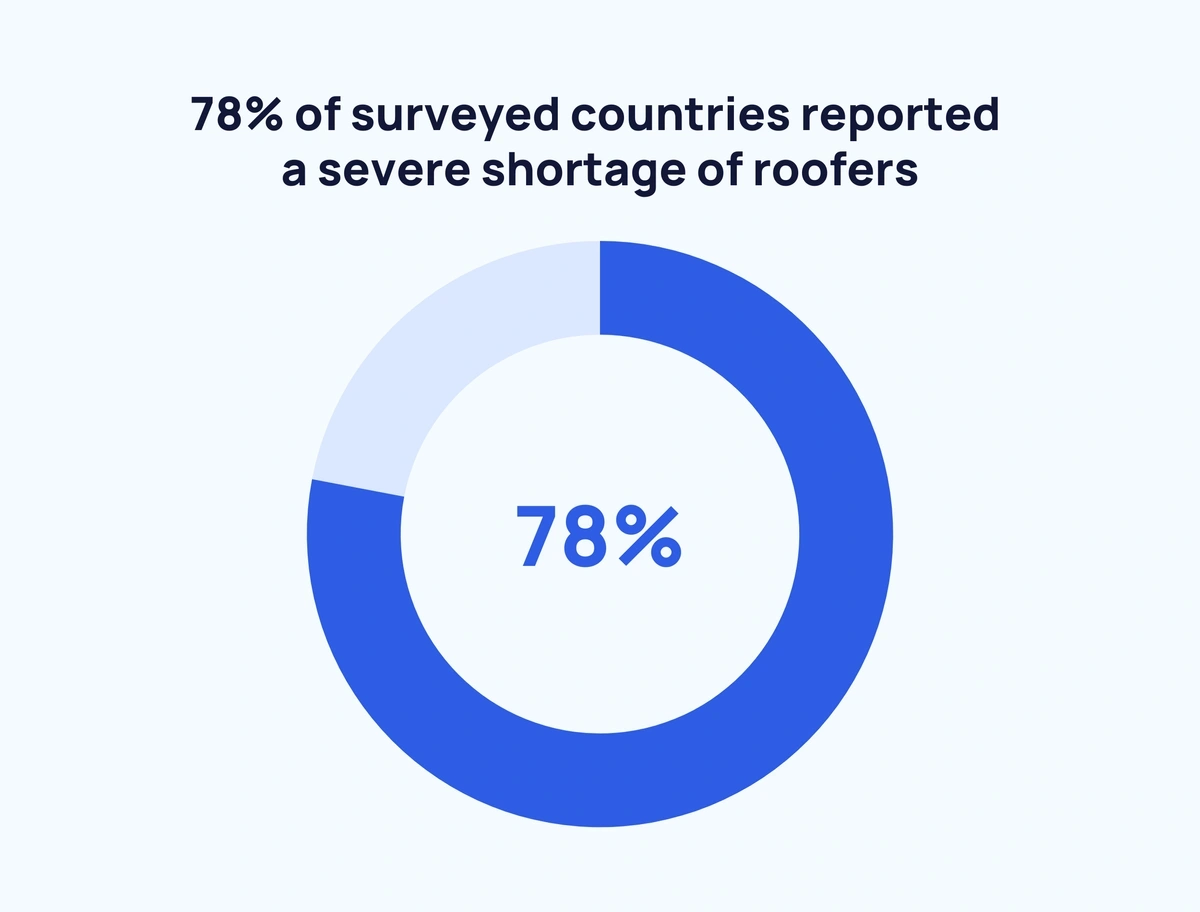
In total, 78% of surveyed countries reported a severe shortage of roofers. This was closely followed by psychologists (75%) and heavy truck drivers (73%).
Here’s a list of shortage occupations and the degree of severity in Europe (2022):
| Occupation | Countries Reporting Occupation as a Shortage | Countries with Severe Shortage |
| Bricklayers and related workers | 19 | 57% |
| Carpenters and joiners | 18 | 38% |
| Heavy truck drivers | 18 | 73% |
| Metal working machine tool setters and operators | 18 | 50% |
| Nursing professionals | 18 | 54% |
| Plumbers and pipe fitters | 18 | 38% |
| Building and related electricians | 18 | 40% |
| Welders and flame cutters | 17 | 54% |
| Concrete placers, concrete finishers, and related workers | 17 | 62% |
| Sheet metal workers | 16 | 44% |
| Floor layers and tile setters | 16 | 36% |
| Software developers | 15 | 58% |
| Cooks | 15 | 55% |
| Building construction laborers | 15 | 38% |
| Electrical mechanics and fitters | 15 | 22% |
| Application programmers | 15 | 64% |
| Generalist medical practitioners | 14 | 55% |
| Bus and tram drivers | 14 | 50% |
| Motor vehicle mechanics and repairers | 14 | 33% |
| Specialist medical practitioners | 14 | 55% |
| Software and applications developers and analysts not elsewhere classified | 14 | 58% |
| Earthmoving and related plant operators | 14 | 44% |
| Waiters | 13 | 44% |
| Early childhood educators | 13 | 43% |
| Structural metal preparers and erectors | 13 | 33% |
| Painters and related workers | 13 | 63% |
| Agricultural and industrial machinery mechanics and repairers | 12 | 67% |
| Bakers, pastry-cooks, and confectionery makers | 12 | 25% |
| Systems analysts | 12 | 56% |
| Butchers, fishmongers, and related food preparers | 12 | 38% |
| Health care assistants | 12 | 60% |
| Cleaners and helpers in offices, hotels, and other establishments | 12* | 63% |
| Electrical engineering technicians | 12 | 63% |
| Psychologists | 11 | 75% |
| Plasterers | 11 | 25% |
| Civil engineers | 11 | 57% |
| Physiotherapists | 11 | 40% |
| Roofers | 11 | 78% |
| Average | - | 50% |
And here’s how those same occupations ranked in previous years:
| Occupation | 2022 | 2021 | 2020 | 2019 | 2017 |
| Bricklayers and related workers | 1st | 7th | 5th | 7th | 6th |
| Carpenters and joiners | 2nd | 6th | 6th | 4th | - |
| Heavy truck and lorry drivers | 2nd | 4th | 3rd | 1st | 4th |
| Metal working machine tool setters and operators | 2nd | 9th | - | - | - |
| Nursing professionals | 2nd | 2nd | 1st | 6th | 4th |
| Plumbers and pipefitters | 2nd | 1st | 2nd | 4th | 2nd |
| Building and related electricians | 2nd | 7th | 5th | 4th | 6th |
| Welders and flame cutters | 3rd | 3rd | 3rd | 2nd | 3rd |
| Concrete placers, concrete finishers, and related workers | 3rd | 6th | 6th | 6th | - |
| Sheet metal workers | 4th | - | - | - | - |
| Floor layers and tile setters | 4th | - | - | - | - |
| Software developers | 5th | 5th | 4th | 8th | 4th |
| Cooks | 5th | 10th | 3rd | 5th | 1st |
| Building construction laborers | 5th | - | - | - | - |
| Electrical mechanics and fitters | 5th | 7th | - | - | - |
| Application programmers | 5th | 8th | 4th | - | - |
| Generalist medical practitioners | 6th | 6th | 4th | 7th | 2nd |
| Bus and tram drivers | 6th | - | - | - | - |
| Motor vehicle mechanics and repairers | 6th | 8th | 7th | 6th | 6th |
| Specialist medical practitioners | 6th | 8th | - | - | - |
| Software and applications developers and analysts not elsewhere classified | 6th | 10th | 6th | 8th | - |
| Earthmoving and related plant operators | 6th | - | - | - | - |
| Waiters | 7th | - | - | - | - |
| Early childhood educators | 7th | - | - | - | - |
| Structural metal preparers and erectors | 7th | - | - | - | - |
| Painters and related workers | 7th | - | - | - | - |
| Agricultural and industrial machinery mechanics and repairers | 8th | 7th | 6th | 3rd | 5th |
| Bakers, pastry-cooks, and confectionery makers | 8th | - | - | - | - |
| Systems analysts | 8th | 3rd | 6th | 2nd | 5th |
| Butchers, fishmongers, and related food preparers | 8th | - | - | - | - |
| Health care assistants | 8th | 8th | 7th | - | - |
| Cleaners and helpers in offices, hotels, and other establishments | 8th | - | - | - | - |
| Electrical engineering technicians | 8th | - | - | - | - |
| Psychologists | 9th | - | - | - | - |
| Plasterers | 9th | - | - | - | - |
| Civil engineers | 9th | 5th | 6th | 8th | - |
| Physiotherapists | 9th | - | - | - | - |
| Roofers | 9th | 10th | - | - | - |
Despite nearing a 50/50 split in the job market, female employees are more prone to periods of unemployment. This is thanks to a disproportionate split in widespread shortage occupations and surplus occupations.
Here are the figures for the gender split in EU27 countries:
| Male | Female | |
| All Occupations | 54% | 46% |
| Widespread Shortage Occupations | 66% | 34% |
| Surplus Occupations | 38% | 62% |
Approximately 17% of the EU27 workforce is made up of under 30s. That equates to over 32 million employees.
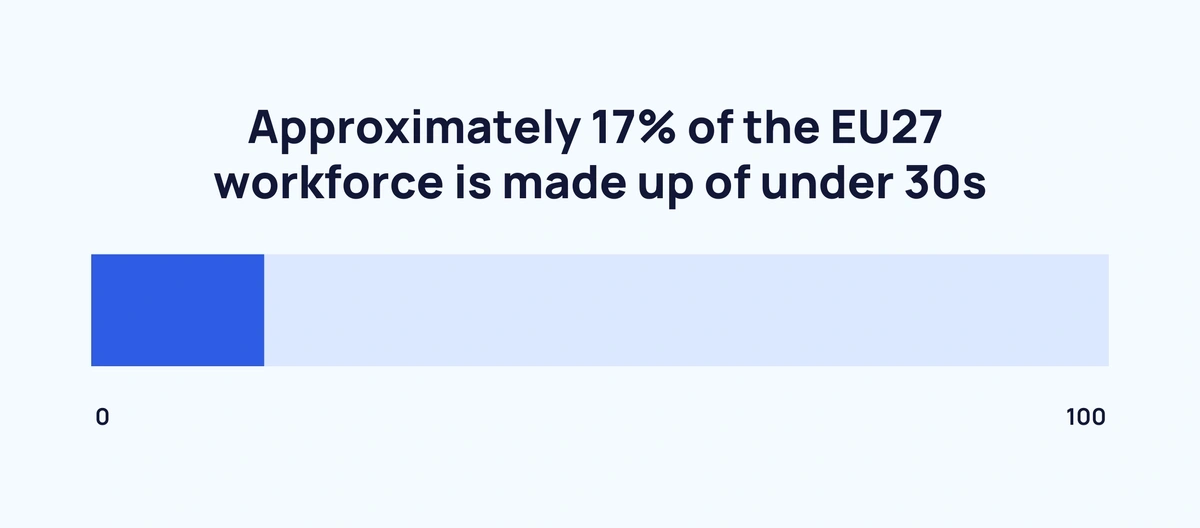
The 15 to 29-year-old age bracket is slightly overrepresented in widespread surplus occupations (20%).
Here’s a breakdown of EU27 employment stats split by age bracket:
| 15 to 29 yo Employees | 30 to 65 yo Employees | |
| All Occupations | 17% | 83% |
| Widespread Shortage Occupations | 18% | 82% |
| Surplus Occupations | 20% | 80% |
Source: EURES
Conclusion
Labor shortages are an important consideration no matter where your business is based.
For more work-related data, take a look at Fascinating Remote Work Statistics, Freelance Statistics, Trends and Insights, and New Outsourcing Statistics.